Our Monitoring Journey
Our “Monitoring” Journey
Travelers: SEEK Asia MY Hirer Team
We started redeveloping our flagship product, SiVA RC, since about 2 years ago. My team and I have been constantly very reactive in resolving live issues on this new platform: we address live issues after Application Support notified us. With the change in greater agility and more frequent deployments of codes and releases of new features/ enhancements, addressing issues in such a manner doesn’t work anymore. Not only did we struggle to meet the SLA for live incidents, it affects us on our initiative to deploy codes and to release features more frequent. We realized that we have to address live issues with different approaches. We believe ‘monitoring’ can help provide insights and fore warnings of ‘health’ issues before they become obvious and serious. As a team, we embarked on this journey together. The following is a journal of our team’s journey into the foray of such monitoring of logs using tools like ELK, New Relic etc.
1. The Journey Began with Kibana Dashboard for quarantined records
-
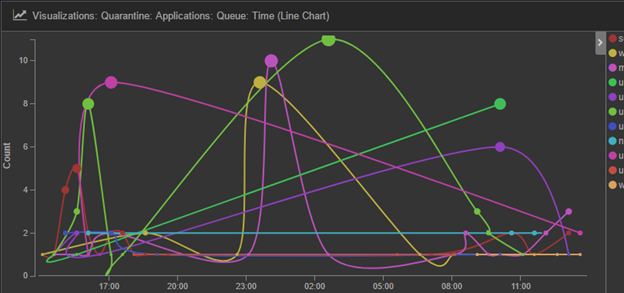
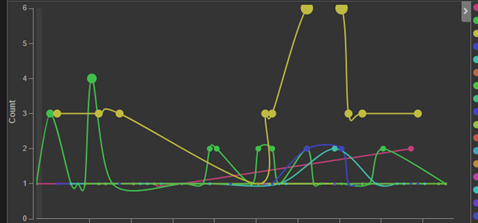
What did we do? In February 2017, we setup a Kibana Dashboard to monitor records that we log into the centralized quarantine table. We setup a visualization that shows the total records inserted into the quarantine table by all queues in real time. A sample is shown in Figure 1.1. Queues are differentiated by colors.
Figure 1.1
-
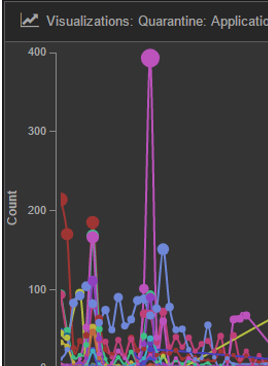
How did it help? We display the dashboard that we setup on a big screen TV near our workstations. Team members can observe the changes while working. On a particular occasion, we observed that the visualization showed a spike in quarantined records for all queues within a very short period of time, as shown in Figure 1.2. We knew immediately that it has to be failure in a ‘common module’ that triggered this. This helped us identified the root cause (some problems with Redis) and rectified the problem before many customers experienced the service interruption.
Figure 1.2
2. We proceed to Sentinl
-
What did we do? To save us from looking at the dashboard 24x7, we setup Sentinl watches to alert us when incidents arise. We first identified the critical queues. That is, if these queues encounter failure and start to insert lots of records as quarantined, customers can’t proceed with their core activities. We then determined the threshold and setup watches that will send out alerts (email and/ or slack) when the total quarantined records within a specific timeframe exceeds the threshold.
-
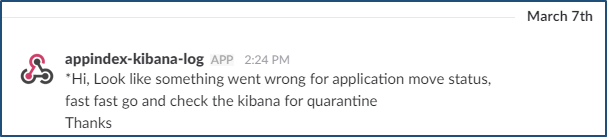
How did it help? Ever since the setup of these watches, we have an additional channel to find out whether there is any failure in our message queues. We can be fully focus during meeting and discussion without having to check on the dashboard every so often. A sample of the alert is shown in Figure 2.1 (please bear with our localized message, engineers are tired of the ‘canned’ error messages).
Figure 2.1
3. The Journey Continues with New Relic Browser Pro
-
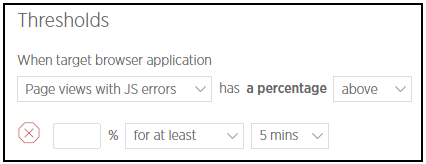
What did we do? The company purchased New Relic Browser Pro license in February. After performing some testing in our staging environment, we setup 2 critical violation alerts in the live environment. Nevertheless, the thresholds are monitored and adjusted whenever necessary. Alert will be sent to us once the condition is met.
- Page views with JS errors (High)
Figure 3.1
- Total page load (High)
Figure 3.2
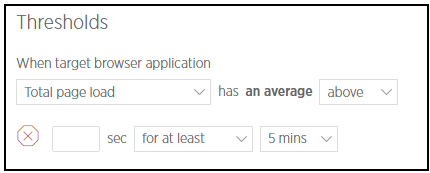
-
How did it help? It is now possible to monitor front-end errors as well as sudden service degradation. It had helped us in several occasions.
4. We visit API monitoring
We were done setting up monitoring and alert for queue messages, front-end errors and performance degradation. Our next stop was API monitoring.
-
What did we do? We wrote a function that performs the followings:
- Use Logstash to read all API errors
- Index them to Elasticsearch
We had also created a visualization in Kibana for these errors.
-
How did it help? With the visualization dashboard shown on our big TV screen, we could notice any sudden spikes and attend to the problem within a short period of time, usually before any user complaints were received. We could also focus on APIs that we had just deployed to monitor them closely. A sample of the visualization is shown in Figure 4.1.
Figure 4.1
5. The Journey’s Next Destination
-
What do we intend to do? As we had setup monitoring for individual service and process, it’s time to attempt to monitor from the ‘business perspective’:
- What do these errors/ alerts actually mean?
- What is the impact to our users?
To answer the questions, we need to first determine the few crucial activities for our users. Examples:
- For hirer, it will be posting of job ad, processing of application
- For candidate, it will be submission of application, updating of resume
We will then identify the critical path of each crucial activity and setup monitoring accordingly. Any failure along these critical paths translates into failure in providing the crucial activities to our users. We must be fast to notice such failure and rectify the problem before it impacts too many users.
We are still in the midst of planning and designing. We will share more once we are done setting this monitoring up.
To end, we would like to state that we believe there are still many grounds that we need to explore and cover in this monitoring journey. As we further our journey, we will continue to share the scenery with whoever interested.
Thank you for traveling with us.